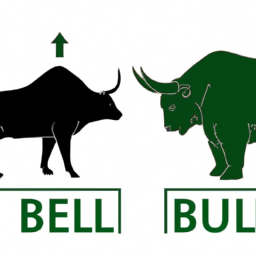
Bearish and Bullish Signals
Introduction
When it comes to investing in the stock market, understanding the various signals that the market sends out is crucial. Two of the most commonly used terms in this regard are bearish and bullish signals. These signals help investors make informed decisions about buying or selling stocks. In this article, we will delve into the meaning of bearish and bullish signals and how they can be identified.
Bearish Signals
Bearish signals indicate a negative sentiment in the market, suggesting that stock prices may decline. Here are some common bearish signals to watch out for:
1. Downtrend in stock prices: If the overall trend in the market is downward, with consecutive lower highs and lower lows, it is a bearish signal. This suggests that the selling pressure is stronger than buying pressure.
2. Breakdown of support levels: When a stock’s price breaks below a significant support level, it indicates a bearish signal. Support levels are price levels at which buying pressure has historically been strong. A breakdown suggests a shift in sentiment towards selling.
3. Increase in trading volume: If there is a significant increase in trading volume during a downtrend, it indicates that more investors are selling their shares. This surge in selling pressure reinforces the bearish signal.
4. Negative news or events: Negative news such as poor earnings reports, regulatory issues, or geopolitical tensions can trigger bearish signals. These events create uncertainty and lead to a decrease in investor confidence.
Bullish Signals
Bullish signals indicate a positive sentiment in the market, suggesting that stock prices may rise. Here are some common bullish signals to watch out for:
1. Uptrend in stock prices: If the overall trend in the market is upward, with consecutive higher highs and higher lows, it is a bullish signal. This suggests that the buying pressure is stronger than selling pressure.
2. Breakout of resistance levels: When a stock’s price breaks above a significant resistance level, it indicates a bullish signal. Resistance levels are price levels at which selling pressure has historically been strong. A breakout suggests a shift in sentiment towards buying.
3. Increase in trading volume: If there is a significant increase in trading volume during an uptrend, it indicates that more investors are buying shares. This surge in buying pressure reinforces the bullish signal.
4. Positive news or events: Positive news such as strong earnings reports, new product launches, or favorable economic indicators can trigger bullish signals. These events create optimism and lead to an increase in investor confidence.
Conclusion
Being able to identify and interpret bearish and bullish signals is essential for successful investing in the stock market. These signals provide valuable insights into market sentiment and help investors make informed decisions about buying or selling stocks. By paying attention to the trends, support and resistance levels, trading volume, and relevant news or events, investors can navigate the market more effectively and potentially increase their chances of success.