# Identifying Common Chart Patterns
Understanding chart patterns is crucial for traders and investors aiming to predict future price movements based on historical data. Chart patterns are distinctive formations created by the price movements of a financial instrument depicted on a chart. Identifying these patterns can help traders make informed decisions. Here, we’ll cover some of the most common chart patterns.
What Are Chart Patterns?
Chart patterns are tools in technical analysis used to predict future price movements by analyzing past and present price action. Patterns emerge due to the psychological and emotional responses of traders to price changes, reflecting the ongoing battle between buyers and sellers. Chart patterns can be categorized into two main types: continuation and reversal patterns. Continuation patterns suggest that the ongoing trend will persist, while reversal patterns indicate a potential change in trend direction.
Common Continuation Patterns
Continuation patterns signify that the market will maintain its current trend after the pattern is completed.
Flags and Pennants
Flags and pennants are short-term continuation patterns that appear in markets undergoing strong trends. A flag pattern is characterized by a rectangle shape that slopes against the current trend, while a pennant resembles a small symmetrical triangle that forms right after a sharp movement. Both suggest that the original trend will resume after a brief pause.
Triangles
Triangles can be classified into symmetric, ascending, and descending triangles. These are formed during consolidation periods where the price converges into a tighter range.
– Symmetric triangles occur when the price converges with equal slope of highs and lows, often leading to a continuation of the prior trend.
– Ascending triangles are identified by a flat upper trendline and a rising lower trendline, indicating bullish continuation.
– Descending triangles present a flat lower trendline and a descending upper trendline, typically indicating bearish continuation.
Common Reversal Patterns
Reversal patterns hint at a potential change in the prevailing trend, either from bullish to bearish or vice versa.
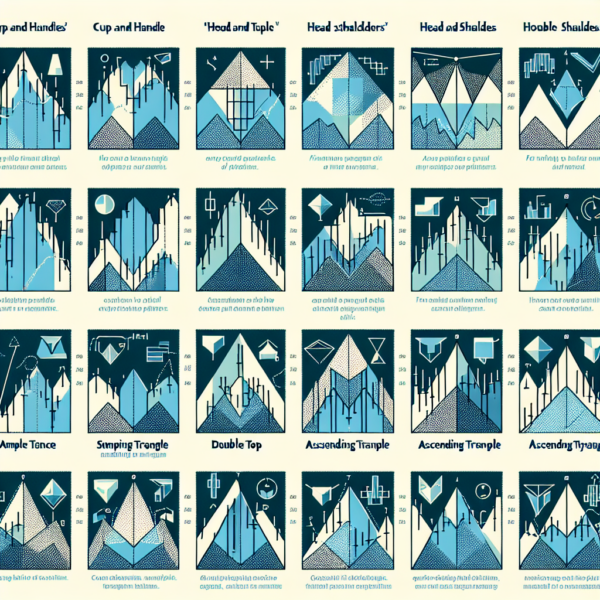
Head and Shoulders
The Head and Shoulders pattern is one of the most reliable reversal patterns. It consists of three peaks: a higher peak (head) between two lower ones (shoulders). This pattern usually occurs at the end of a bullish trend, signaling a shift to a bearish trend.
Double Tops and Bottoms
Double tops and bottoms are among the simplest reversal patterns. A double top forms after a lengthy bullish trend, depicting two consecutive peaks with a moderate trough in-between, signaling a forthcoming bearish reversal. Conversely, a double bottom, characterized by two consecutive valleys separated by a peak, indicates a bullish reversal following a bearish trend.
Inverse Head and Shoulders
This pattern is the opposite of the Head and Shoulders, signaling a reversal from a bearish trend to a bullish trend. It features two lower side peaks (shoulders) and a deeper central trough (head), suggesting an upcoming bullish movement.
How to Trade Chart Patterns
Trading based on chart patterns involves more than just pattern recognition. Traders also consider volume, the pattern’s context within the broader market trend, and other indicators to substantiate their predictions.
– Entry points are usually established upon the pattern’s completion—e.g., following a breakout from the pattern’s boundaries.
– Stop-loss orders are typically placed just outside the pattern’s boundary to protect against false breakouts or unexpected reversals.
– The projected price move can often be estimated by the height of the pattern itself. For example, the distance from the bottom to the top of a head and shoulders pattern can be projected downwards from the neckline to set a target price.
In conclusion, the ability to identify and interpret common chart patterns can significantly enhance trading strategies. By combining these patterns with other analysis tools and a disciplined trading approach, traders can improve their chances rigorously testing their interpretations against historical data and current market conditions is crucial for success.