Technical Analysis
Welcome to the Technical Analysis section of Valifind.com, your go-to source for insights and strategies to help you navigate the financial markets with precision and confidence. Is a crucial tool for traders and investors looking to make data-driven decisions. At Valifind.com, we provide in-depth analysis, charts, and expert commentary to help you understand market trends, price movements, and potential trading opportunities. Whether you’re a beginner or a seasoned trader, our section is designed to enhance your trading skills and maximize your investment returns. Understanding – is essential for anyone serious about trading or investing. By analyzing price patterns, volume, and other market data, technical analysis helps predict future market movements and identify potential entry and exit points. Our team of experienced analysts at Valifind.com offers a wealth of knowledge to help you grasp the fundamentals and advanced techniques of technical analysis. We focus on practical, actionable insights that you can apply directly to your trading strategies, ensuring you stay ahead of market trends and make informed decisions.


Mastering Risk Management with Technical Analysis
Risk Management Using Technical Analysis Investing in the financial markets can be a lucrative endeavor, yet it comes with its share of risks. To mitigate these risks, investors employ various strategies, with technical analysis standing out as a pivotal tool for many. By understanding and applying technical analysis effectively, investors can manage their risk and safeguard their investments agai...[Read More]


Mastering Trend Line Drawing: A Comprehensive Guide
# Trend Line Drawing Methods: An Insightful Guide Drawing trend lines is a fundamental skill in technical analysis that helps traders and investors identify the direction of the market trend. This practice can pinpoint support and resistance levels, enabling better decision-making. This article explores various trend line drawing methods, focusing on why they are crucial in market analysis. Unders...[Read More]


Effective Risk Management Strategies for Traders
Implementing Risk Management in Trading Risk management is a critical component of successful trading. It allows traders to manage their exposure to losses and enhances their ability to make informed decisions under varying market conditions. This article outlines the key strategies and principles involved in implementing effective risk management in trading activities. Understanding Risk Manageme...[Read More]


Mastering Volume Spikes and Market Reversals
Understanding Volume Spikes and Market Reversals Tracking and understanding the dynamics of the stock market can be a daunting task for both seasoned traders and novices alike. Among the myriad signals and indicators used, volume spikes and market reversals stand out for their ability to hint at potential shifts in market sentiment. This article aims to decode these phenomena, offering insights in...[Read More]


Mastering Overbought and Oversold Market Conditions
# Analyzing Overbought and Oversold Conditions In the financial markets, understanding when an asset is overbought or oversold is crucial for both traders and investors. These conditions can provide indications about the potential future movements of an asset’s price. This article explores what overbought and oversold conditions mean, how to identify them, and strategies to navigate these si...[Read More]


Effective RSI Strategies for Enhanced Market Analysis
Understanding RSI in Market Analysis The Relative Strength Index (RSI) is a momentum oscillator that measures the speed and change of price movements. It operates on a scale of 0 to 100, indicating whether a stock is overbought (above 70) or oversold (below 30). Developed by J. Welles Wilder Jr., the RSI is a popular tool among traders for identifying potential buy or sell signals. Basics of RSI C...[Read More]


Mastering Sentiment Indicators for Market Predictions
Introduction to Sentiment Indicators Sentiment indicators play a crucial role in forecasting the direction of financial markets. They measure the overall attitude of investors towards a particular security or the market as a whole. By analyzing sentiment indicators, traders and investors attempt to gauge the mood of the market to make informed decisions. This article delves into how sentiment indi...[Read More]

Mastering Moving Averages for Effective Trend Analysis
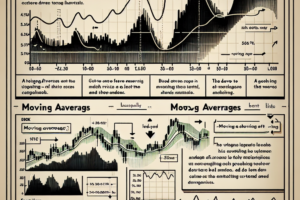
Introduction to Moving Averages in Trend Analysis Moving averages are crucial tools used in trend analysis, allowing traders and analysts to understand market directions by smoothing out price data over a specified period. These averages help in identifying the direction of the trend and in making predictions about future price movements. This article dives into how moving averages can be employed...[Read More]


Mastering Advanced Candlestick Patterns for Trading
Introduction to Advanced Candlestick Patterns Candlestick patterns are integral to technical analysis, offering deep insights into market sentiment and potential price movements. While basic patterns provide a foundation for understanding market dynamics, advanced candlestick patterns offer a more nuanced view, enabling traders to make more informed decisions. These patterns, often involving more ...[Read More]


Trend Analysis with Moving Averages Explained
Understanding Trend Analysis Using Moving Averages Trend analysis is a pivotal technique used in the financial market to gauge the direction in which a stock, commodity, or any tradable asset is moving. Among the myriad tools available for trend analysis, moving averages stand out for their simplicity and efficacy. This article delves into how moving averages are employed in trend analysis, sheddi...[Read More]

Unlocking the Potential of Bollinger Band Squeeze Strategy
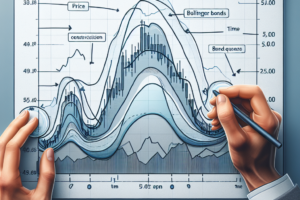
# Mastering the Bollinger Band Squeeze Technique The Bollinger Band squeeze technique is a pivotal strategy used by traders to identify breakout signals in the forex, stocks, and commodities markets. This technical analysis tool is centered around the Bollinger Bands, which consist of a middle simple moving average (SMA) and two outer bands that are standard deviations away from the SMA. The squee...[Read More]


Navigating the Ebb and Flow of Market Cycles
Understanding Market Cycles Market cycles play a pivotal role in the world of investing and economics. Grasping the concept of these cycles can aid investors in making informed decisions, foreseeing economic trends, and mitigating risks. This article delves into the essence of market cycles, their phases, and how investors can navigate through them. What are Market Cycles? At its core, a market cy...[Read More]