Technical Analysis
Welcome to the Technical Analysis section of Valifind.com, your go-to source for insights and strategies to help you navigate the financial markets with precision and confidence. Is a crucial tool for traders and investors looking to make data-driven decisions. At Valifind.com, we provide in-depth analysis, charts, and expert commentary to help you understand market trends, price movements, and potential trading opportunities. Whether you’re a beginner or a seasoned trader, our section is designed to enhance your trading skills and maximize your investment returns. Understanding – is essential for anyone serious about trading or investing. By analyzing price patterns, volume, and other market data, technical analysis helps predict future market movements and identify potential entry and exit points. Our team of experienced analysts at Valifind.com offers a wealth of knowledge to help you grasp the fundamentals and advanced techniques of technical analysis. We focus on practical, actionable insights that you can apply directly to your trading strategies, ensuring you stay ahead of market trends and make informed decisions.
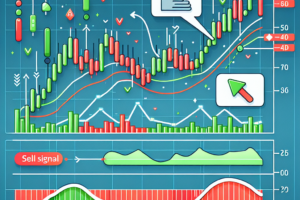

Mastering MACD: Key Strategies for Trading Signals
Understanding MACD: A Powerful Tool for Traders The Moving Average Convergence Divergence (MACD) is a popular technical analysis tool used by traders across various financial markets. Developed by Gerald Appel in the late 1970s, the MACD is designed to reveal changes in the strength, direction, momentum, and duration of a trend in a stock’s price. At its core, the MACD is a trend-following m...[Read More]


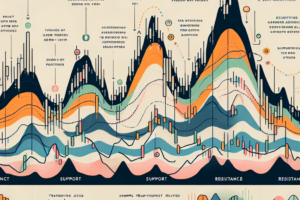
Mastering Support and Resistance in Trading
Understanding Support and Resistance Zones in Trading Trading financial markets involves analyzing charts to predict future price movements. A fundamental aspect of chart analysis is identifying key areas where price has shown a tendency to either reverse or consolidate. These areas are known as support and resistance zones. Understanding these zones can significantly enhance your trading strategy...[Read More]


A Guide to Identifying Common Chart Patterns
# Identifying Common Chart Patterns Understanding chart patterns is crucial for traders and investors aiming to predict future price movements based on historical data. Chart patterns are distinctive formations created by the price movements of a financial instrument depicted on a chart. Identifying these patterns can help traders make informed decisions. Here, we’ll cover some of the most c...[Read More]


How to Identify Reliable Support Levels in Trading
Finding Reliable Support Levels in Trading Finding Reliable Support Levels in Trading Understanding the concept of support levels is crucial for traders aiming to maximize their investment returns while minimizing risks. Support levels, in the context of trading, refer to a price level at which a declining asset tends to stop falling and may even bounce back upwards, due to a concentration of dema...[Read More]
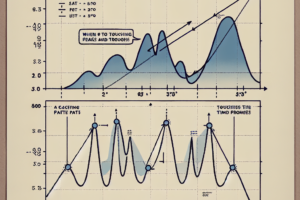

Mastering the Art of Drawing Accurate Trend Lines
Drawing Accurate Trend Lines Trend lines are a foundational aspect of technical analysis in trading and investing. They help traders identify market direction, support and resistance levels, and potential breakout points. Drawing accurate trend lines, however, is both an art and a science. This article will guide you through the essential steps and tips for drawing accurate trend lines that can se...[Read More]


Harnessing Sentiment Analysis in Technical Trading
# Sentiment Analysis in Technical Trading In the rapidly evolving world of financial markets, understanding and predicting the movement of asset prices is vital for traders and investors. While traditional technical analysis focuses on historical market data, sentiment analysis has emerged as a powerful tool, harnessing the vast amounts of information generated by market participants. This article...[Read More]


Mastering Price Action Trading Techniques
Understanding Price Action Trading Price action trading is a methodology that relies on historical prices to inform trading strategies, eschewing the use of technical indicators in favor of price movements themselves. Proponents argue that since price is the ultimate indicator, understanding how it behaves provides the most direct insight into market sentiment. This technique involves observing an...[Read More]


Mastering Pivot Points for Effective Day Trading
Introduction to Pivot Points in Day Trading Pivot points are a popular tool among day traders for determining potential support and resistance levels in the financial markets. Originating from the floor trading days, pivot points offer a simple yet effective way to gauge market sentiment and potential price movements. By calculating pivot points, traders can identify key levels where the price of ...[Read More]


Unveiling the Power of Volume Analysis in Trading
# Mastering Volume Analysis Techniques in Trading Volume analysis is a crucial aspect of trading that can significantly enhance a trader’s ability to make informed decisions. By understanding the various techniques available, traders can gain insights into market strength, potential reversals, and the confirmation of trends. This article explores key volume analysis techniques that can be le...[Read More]

Exploring Support and Resistance Trading Techniques
Mastering Support and Resistance Trading Strategies Trading based on support and resistance levels is a method used by countless traders across various markets. This technique revolves around the concept of identifying price levels on charts where an asset’s price movement is likely to pause or reverse. These key levels act as barriers, within which traders can make informed decisions to ent...[Read More]


Understanding and Trading with Harmonic Patterns
# Harmonic Patterns in Trading: A Guide to Market Geometry Trading in the financial markets can often seem like navigating a labyrinth of numbers and charts, but for those who understand the language of the market, these numbers and charts reveal repeating patterns and signals. Among these, harmonic patterns stand out for their ability to predict future movements by identifying natural and geometr...[Read More]


Mastering Resistance Breakout Trading Strategies
# Mastering Resistance Breakout Strategies In the dynamic world of trading, understanding and effectively implementing resistance breakout strategies can significantly enhance a trader’s ability to capitalize on market movements. This article delves into the core of resistance breakout strategies, offering you a structured approach to master these techniques. ## Understanding Resistance Brea...[Read More]