Technical Analysis
Welcome to the Technical Analysis section of Valifind.com, your go-to source for insights and strategies to help you navigate the financial markets with precision and confidence. Is a crucial tool for traders and investors looking to make data-driven decisions. At Valifind.com, we provide in-depth analysis, charts, and expert commentary to help you understand market trends, price movements, and potential trading opportunities. Whether you’re a beginner or a seasoned trader, our section is designed to enhance your trading skills and maximize your investment returns. Understanding – is essential for anyone serious about trading or investing. By analyzing price patterns, volume, and other market data, technical analysis helps predict future market movements and identify potential entry and exit points. Our team of experienced analysts at Valifind.com offers a wealth of knowledge to help you grasp the fundamentals and advanced techniques of technical analysis. We focus on practical, actionable insights that you can apply directly to your trading strategies, ensuring you stay ahead of market trends and make informed decisions.


Understanding and Using Moving Averages for Effective Trend Analysis
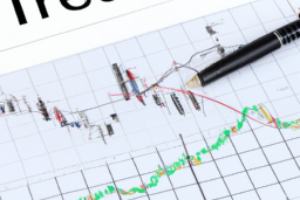
Using Moving Averages for Trend Analysis Introduction One of the most commonly used tools in technical analysis is the moving average. It is a simple, yet powerful tool that helps traders identify the current trend direction and potential reversal points. This article will delve into the concept of moving averages and how they can be used for trend analysis. What is a Moving Average? A moving aver...[Read More]


Exploring Advanced Candlestick Patterns in Financial Trading
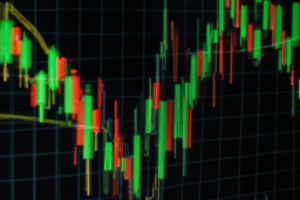
Introduction to Advanced Candlestick Patterns Candlestick charts are a popular tool used by traders and investors to visualize price movements in the financial markets. Originating from Japan over 300 years ago, this technique has gained widespread acceptance due to its ability to provide a quick understanding of the open, high, low, and close prices. Beyond the basic patterns, advanced candlestic...[Read More]

Guide to Trend Analysis Using Moving Averages in Trading
Trend Analysis Using Moving Averages Trend analysis is a critical aspect of financial market analysis, helping traders to understand the direction in which a particular asset or market is moving. One of the most commonly used methods for trend analysis is the Moving Averages (MA). This article will delve into the concept of Moving Averages, their types, and how they are used in trend analysis. Und...[Read More]


Mastering the Bollinger Band Squeeze Technique in Trading
Bollinger Band Squeeze Technique The Bollinger Band squeeze technique is a popular method used by traders to identify potential breakout opportunities in the market. This technique is based on the Bollinger Bands indicator, which was developed by John Bollinger in the 1980s. It can be used in various market conditions and across different timeframes, making it a versatile tool for traders. In this...[Read More]

Mastering Trade Signals with the Moving Average Convergence Divergence (MACD)
Introduction to MACD The Moving Average Convergence Divergence (MACD) is a popular trend-following momentum indicator that shows the relationship between two moving averages of a security’s price. The MACD is calculated by subtracting the 26-day exponential moving average (EMA) from the 12-day EMA. A nine-day EMA of the MACD, known as the “signal line,” is then plotted on top of ...[Read More]

Understanding and Trading with Harmonic Patterns in the Market
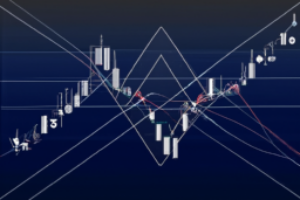
Introduction to Trading with Harmonic Patterns Trading with harmonic patterns is a sophisticated method of technical analysis that utilizes precise geometric price patterns to identify potential reversal points in the financial markets. This approach draws heavily from the work of H.M. Gartley, who introduced the concept in his 1932 book “Profits in the Stock Market.” Over time, other ...[Read More]


Mastering the Art of Identifying Key Support and Resistance Zones
Introduction to Support and Resistance Zones In the world of technical analysis in trading, support and resistance zones are crucial elements to understand. These zones are pivotal in identifying potential price reversals, breakouts, and trend continuations, thereby helping traders to make informed decisions. What are Support and Resistance Zones? Support and resistance zones are specific price le...[Read More]


Guide to Identifying Reliable Support Levels in Trading
Finding Reliable Support Levels In the world of trading, the concept of support levels is fundamental. These levels represent a price point where buying interest is strong enough to overcome selling pressure, leading to a price bounce. However, not all support levels are created equal. Some may be more reliable than others, and identifying these reliable support levels can significantly improve yo...[Read More]


Exploring the Role of Sentiment Analysis in Technical Trading
Introduction Sentiment analysis, also known as opinion mining, is a field of study that analyzes people’s feelings, attitudes, and emotions towards certain subjects. In the realm of finance and investment, sentiment analysis has gained significant popularity in technical trading. It involves the use of complex algorithms to interpret and understand the sentiments of market participants, ther...[Read More]

Exploring Price Action Trading Techniques and Their Benefits
Understanding Price Action Trading Techniques Price action trading is a method that focuses on the study of historical prices to formulate technical trading strategies. It ignores the fundamental analysis factors and instead focuses on recent and past price movement. This article will delve into the various techniques used in price action trading. What is Price Action Trading? Price action trading...[Read More]

Mastering Pivot Points: A Key Strategy for Successful Day Trading
Introduction to Pivot Points in Day Trading Day trading is a high-speed, high-stakes game of strategy and analysis. One of the key tools that traders use to navigate this fast-paced environment is pivot points. These are technical analysis indicators that help traders identify potential points of currency pair price movement. Pivot points are used by day traders to determine critical price levels ...[Read More]


Mastering Algorithmic Trading Using Technical Indicators
Algorithmic Trading with Technical Indicators Introduction to Algorithmic Trading Algorithmic trading, also known as algo-trading or black-box trading, is a method of executing orders using automated pre-programmed trading instructions accounting for variables such as time, price, and volume. This type of trading was developed so traders can respond to market changes in real-time and without human...[Read More]