Technical Analysis
Welcome to the Technical Analysis section of Valifind.com, your go-to source for insights and strategies to help you navigate the financial markets with precision and confidence. Is a crucial tool for traders and investors looking to make data-driven decisions. At Valifind.com, we provide in-depth analysis, charts, and expert commentary to help you understand market trends, price movements, and potential trading opportunities. Whether you’re a beginner or a seasoned trader, our section is designed to enhance your trading skills and maximize your investment returns. Understanding – is essential for anyone serious about trading or investing. By analyzing price patterns, volume, and other market data, technical analysis helps predict future market movements and identify potential entry and exit points. Our team of experienced analysts at Valifind.com offers a wealth of knowledge to help you grasp the fundamentals and advanced techniques of technical analysis. We focus on practical, actionable insights that you can apply directly to your trading strategies, ensuring you stay ahead of market trends and make informed decisions.


Exploring Key Volume Analysis Techniques in Trading
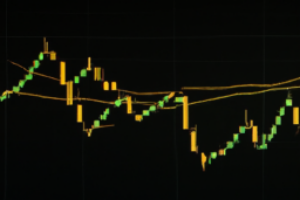
Volume Analysis Techniques Volume analysis is a key aspect of technical analysis that involves the examination of the number of shares or contracts traded in a security or an entire market during a given period. It is an important tool for traders and investors to understand the relationship between volume and price movements, and to predict future market trends. In this article, we will discuss s...[Read More]

Exploring Algorithmic Strategies in Technical Analysis
Algorithmic Strategies in Technical Analysis Technical analysis is a trading discipline employed to evaluate investments and identify trading opportunities by analyzing statistical trends gathered from trading activity, such as price movement and volume. Unlike fundamental analysts, who attempt to evaluate a security’s intrinsic value, technical analysts focus on charts of price movement and...[Read More]

Understanding and Utilizing Harmonic Patterns in Trading
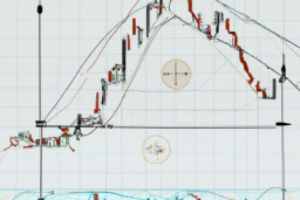
Harmonic Patterns in Trading Trading in the financial markets involves a lot of strategic planning and analysis. Among the various strategies traders use, one of the most effective ones is the use of harmonic patterns. These patterns are precise, mathematically based patterns that are used to identify potential turning points in the market. What are Harmonic Patterns? Harmonic patterns in trading ...[Read More]

Mastering the Resistance Breakout Strategy in Trading
Understanding Resistance Breakout Strategies in Trading In the world of trading, understanding and implementing effective strategies is key to success. One such strategy is the resistance breakout strategy, which is used by traders to identify potential buying opportunities in the market. In this article, we will delve into what a resistance breakout strategy is, how it works, and how you can use ...[Read More]


Applying Dow Theory Principles to Modern Financial Markets
Introduction to Dow Theory The Dow Theory is a fundamental framework for technical analysis in financial markets, formulated from a series of Wall Street Journal editorials authored by Charles H. Dow, co-founder of Dow Jones and Company. Despite its inception over a century ago, Dow Theory remains a cornerstone of technical analysis, offering traders and investors valuable insights into market tre...[Read More]


A Comprehensive Guide to Event-Driven Market Analysis
Event-Driven Market Analysis: A Comprehensive Guide Introduction to Event-Driven Market Analysis Event-driven market analysis is a method of evaluating and predicting the market’s potential movement based on significant events. These events can be anything from earnings reports, product launches, mergers and acquisitions, to geopolitical events or natural disasters. The idea is that these ev...[Read More]


Mastering Bollinger Bands for Effective Trading Strategies
Using Bollinger Bands for Trading Introduction to Bollinger Bands Bollinger Bands are a powerful technical analysis tool developed by John Bollinger in the 1980s. They are used by traders to measure volatility and identify potential buy and sell signals in the market. Bollinger Bands consist of a simple moving average (SMA) line, with two standard deviation lines plotted above and below it. The di...[Read More]


Understanding the Process and Importance of Backtesting in Trading
Backtesting with Historical Data Introduction Backtesting is an essential process in the world of trading and investment. It involves applying a trading strategy or analytical method to historical data to see how accurately the strategy or model predicts future results. This technique is used to verify the effectiveness of a trading strategy before it is implemented in the live market, thereby min...[Read More]

Exploring Fibonacci Extensions in Trading: A Comprehensive Guide
Introduction to Fibonacci Extensions in Trading Fibonacci extensions are a popular tool among technical traders. They are derived from the mathematical Fibonacci sequence, which is a series of numbers where each number is the sum of the two preceding ones, often starting with 0 and 1. In trading, Fibonacci extensions are used to predict potential levels of support and resistance, which can help tr...[Read More]

Mastering Pivot Point Trading Strategies for Successful Day Trading
Introduction to Pivot Point Trading Strategies Pivot point trading strategies are prevalent among day traders. These strategies allow traders to determine critical price levels that can be used to define trades. Pivot points are calculated using the high, low, and closing prices of the previous trading day. Depending on the situation, traders may use pivot points to identify potential levels of su...[Read More]

Mastering Fibonacci Trading: An In-depth Guide to Extensions
Introduction to Fibonacci Trading Fibonacci trading is a popular technique used by many traders to predict potential price levels for buying and selling assets. It is based on the mathematical Fibonacci sequence, where each number is the sum of the two preceding ones, starting from 0 and 1. The sequence is as follows: 0, 1, 1, 2, 3, 5, 8, 13, 21, 34, and so on. This sequence is then translated int...[Read More]

Understanding and Applying Elliott Wave Forecasting Models
Introduction to Elliott Wave Forecasting Models The world of financial markets is a complex and dynamic system that involves a multitude of factors. To navigate this system and predict market trends, traders and investors use various types of analytical methods. One such method that has gained significant popularity over the years is the Elliott Wave Principle. This principle, or model, is a form ...[Read More]