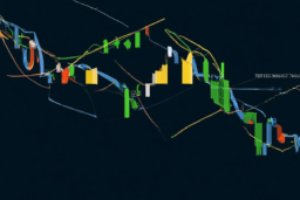
Technical Analysis
Welcome to the Technical Analysis section of Valifind.com, your go-to source for insights and strategies to help you navigate the financial markets with precision and confidence. Is a crucial tool for traders and investors looking to make data-driven decisions. At Valifind.com, we provide in-depth analysis, charts, and expert commentary to help you understand market trends, price movements, and potential trading opportunities. Whether you’re a beginner or a seasoned trader, our section is designed to enhance your trading skills and maximize your investment returns. Understanding – is essential for anyone serious about trading or investing. By analyzing price patterns, volume, and other market data, technical analysis helps predict future market movements and identify potential entry and exit points. Our team of experienced analysts at Valifind.com offers a wealth of knowledge to help you grasp the fundamentals and advanced techniques of technical analysis. We focus on practical, actionable insights that you can apply directly to your trading strategies, ensuring you stay ahead of market trends and make informed decisions.


Mastering Risk Management in Investments through Technical Analysis
Introduction to Risk Management Using Technical Analysis Risk management is a crucial aspect of any investment strategy. It involves identifying, evaluating, and mitigating potential losses in investments. One of the most effective ways to manage risk is through technical analysis. This is a method that uses past market data, primarily price and volume, to predict future market behavior. This arti...[Read More]


Exploring Different Methods for Drawing Trend Lines
Trend Line Drawing Methods Trend lines are a fundamental tool in technical analysis for both trend identification and confirmation. A trend line is a straight line that connects two or more price points and then extends into the future to act as a line of support or resistance. Many of the principles applicable to support and resistance levels can be applied to trend lines as well. In this article...[Read More]


Implementing Effective Risk Management Strategies in Trading
Introduction to Risk Management in Trading Trading, whether it’s stocks, forex, or commodities, involves a certain degree of risk. While it’s impossible to completely eliminate risk, effective risk management strategies can significantly mitigate potential losses and protect your trading capital. This article will guide you through the key steps and strategies for implementing risk man...[Read More]


Using the Relative Strength Index (RSI) to Identify Market Momentum
Introduction to RSI and Market Momentum The Relative Strength Index, or RSI, is a popular tool used by traders and investors for identifying market momentum. Developed by J. Welles Wilder, the RSI is a momentum oscillator that measures the speed and change of price movements. It helps to identify overbought or oversold conditions in a market, thus providing potential entry and exit points for trad...[Read More]


Understanding Dow Theory for Effective Market Forecasting
Introduction to Dow Theory Dow Theory is one of the most fundamental theories in technical analysis of the stock market. Named after Charles H. Dow, co-founder of Dow Jones & Company and the Wall Street Journal, it was never officially written by Dow himself but was instead derived from his editorials and writings on the stock market. This theory is based on six basic tenets that assist trade...[Read More]


Utilizing RSI Divergence for Effective Trade Entry Strategies
Introduction to RSI Divergence The Relative Strength Index (RSI) is a momentum oscillator that measures the speed and change of price movements. It was developed by J. Welles Wilder and introduced in his 1978 book, “New Concepts in Technical Trading Systems”. The RSI is primarily used to identify overbought or oversold conditions in a market, but it can also be used to identify diverge...[Read More]


Mastering Advanced Ichimoku Cloud Trading Strategies
Introduction to Advanced Ichimoku Cloud Strategies The Ichimoku Cloud, also known as Ichimoku Kinko Hyo, is a versatile indicator that defines support and resistance, identifies trend direction, gauges momentum, and provides trading signals. The indicator was developed by Goichi Hosoda, a Japanese journalist, in the late 1930s. It provides more data points than the standard candlestick chart, maki...[Read More]


Understanding and Implementing Backtesting of Trading Indicators
Introduction to Backtesting Trading Indicators Backtesting trading indicators is a critical process in the development and evaluation of trading strategies. It involves using historical data to test the viability of a trading strategy or indicator before it is applied in real-time trading. This process is crucial in assessing the potential profitability and risk of a trading strategy, and can help...[Read More]


Mastering Trading Strategies: Understanding Support and Resistance Levels
Introduction to Support and Resistance Levels Support and resistance levels are fundamental concepts in trading that every investor should understand. They are used to identify potential market reversal points and are typically used in conjunction with other technical analysis tools to make better trading decisions. The concept of support and resistance levels revolves around the supply and demand...[Read More]


A Comprehensive Guide to Identifying RSI Divergence
Introduction to RSI Divergence RSI, or Relative Strength Index, is a popular tool used by traders to identify potential buy and sell opportunities in the market. It’s a momentum oscillator that measures the speed and change of price movements. One of the key concepts associated with RSI is divergence. Divergence occurs when the price of an asset is moving in the opposite direction of a techn...[Read More]

Mastering Trading Strategies: A Guide to MACD Crossovers
Introduction to MACD The Moving Average Convergence Divergence (MACD) is a trend-following momentum indicator that shows the relationship between two moving averages of a security’s price. Traders use it to identify possible buy and sell points. It consists of the MACD line, the signal line, and the histogram. Understanding MACD Crossovers MACD crossovers are a popular trading strategy for b...[Read More]

Understanding and Applying Elliott Wave Analysis in Trading
Introduction to Elliott Wave Analysis Elliott Wave analysis is a method of technical analysis that looks for recurrent long-term price patterns related to persistent changes in investor sentiment and psychology. The theory was developed by Ralph Nelson Elliott in the 1930s, based on his belief that, because we can identify repetitive patterns in nature, similar patterns should be identifiable in h...[Read More]