Drawing Accurate Trend Lines
Trend lines are a foundational aspect of technical analysis in trading and investing. They help traders identify market direction, support and resistance levels, and potential breakout points. Drawing accurate trend lines, however, is both an art and a science. This article will guide you through the essential steps and tips for drawing accurate trend lines that can serve as a solid foundation for your trading decisions.
Understanding the Basics of Trend Lines
Before diving into the how-tos of drawing trend lines, it’s crucial to understand what trend lines are and why they are important. A trend line is a straight line that connects two or more price points and then extends into the future to act as a line of support or resistance. There are two main types of trend lines: uptrend lines and downtrend lines.
Uptrend Lines
Uptrend lines are drawn along the higher lows in an ascending market. These lines showcase the support level from which prices are expected not to fall, indicating a bullish market sentiment.
Downtrend Lines
Conversely, downtrend lines connect the lower highs in a descending market, representing resistance levels that prices are presumed not to exceed, signaling bearish market conditions.
Steps to Drawing Accurate Trend Lines
Drawing trend lines might seem straightforward, but accuracy is key for them to be effective. Follow these steps to ensure your trend lines are precise and reliable.
Step 1: Identify the Trend
The first step is to clearly identify the current market trend. Look for a series of higher lows in an uptrend or lower highs in a downtrend. This step is crucial because applying trend lines to a market without a clear trend can result in misleading signals.
Step 2: Connect Price Points
Once you’ve identified the trend, select at least two major price points within the trend to connect with a line. For an uptrend, these will be significant lows, and for a downtrend, significant highs. It’s recommended to use a line chart for this purpose as it makes identifying closing prices easier.
Step 3: Adjust for Best Fit
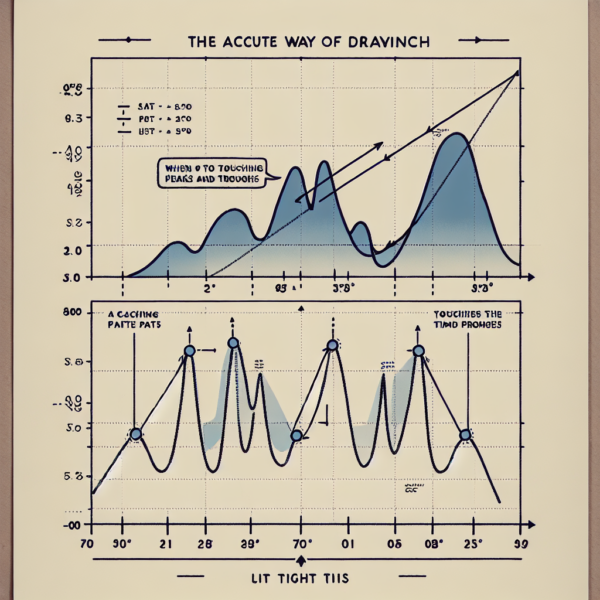
After connecting the initial points, adjust your line to connect as many price points as possible without cutting through the body of a candlestick. For the most accurate trend line, you want the line to touch the most number of peaks or troughs, depending on the trend direction.
Step 4: Confirm the Trend Line
A trend line is considered valid when it has been touched or approached closely by the price at least three times. The more touches the trend line has, without breaking it, the stronger and more significant it becomes.
Tips for Drawing More Accurate Trend Lines
Here are some advanced tips to refine your trend line drawing skills:
Tip 1: Use Longer Time Frames
Trend lines drawn on longer time frames (daily, weekly, monthly) tend to be more reliable than those on shorter time frames. This is because they encapsulate more data points and reduce market “noise.”
Tip 2: Avoid Forcing the Line
If a trend line does not fit well, do not force it by ignoring some price points or stretching it unnaturally. An accurate trend line should naturally align with key price points.
Tip 3: Pay Attention to Angles
The angle of a trend line can indicate the strength of the trend. Steeper trends may be less sustainable over the long term, potentially signaling a sharper correction or reversal.
Conclusion
Drawing accurate trend lines is a critical skill in technical analysis that, when mastered, can significantly enhance your market analysis and decision-making process. By following the steps and tips outlined in this article, you’ll be well-equipped to draw trend lines that can help you identify potential entry and exit points, forecast market direction, and spot reversals and breakouts. Like any skill, proficiency in drawing trend lines comes with practice and continuous learning.
