# Harmonic Patterns in Trading: A Guide to Market Geometry
Trading in the financial markets can often seem like navigating a labyrinth of numbers and charts, but for those who understand the language of the market, these numbers and charts reveal repeating patterns and signals. Among these, harmonic patterns stand out for their ability to predict future movements by identifying natural and geometric price formations. In this article, we’ll delve into the basics of harmonic patterns in trading, how they work, and how traders can use them to identify potential market moves.
##
Understanding Harmonic Patterns
Harmonic patterns are based on the principle that market movements inherently follow geometric price patterns that are influenced by human behavior and market psychology. These patterns leverage Fibonacci numbers, a sequence of numbers where each number is the sum of the two preceding ones (0, 1, 1, 2, 3, 5, 8, 13, 21, …). This sequence and the related Golden Ratio (approximately 1.618 or 0.618) are found extensively in nature, art, architecture, and even financial markets.
##
Types of Harmonic Patterns
There are several harmonic patterns traders look out for, each with its unique set of rules and Fibonacci ratios. Some of the most commonly used ones include:
###
Gartley Pattern
The Gartley pattern, named after H.M. Gartley who introduced it in his book “Profits in the Stock Market,” is a 5-point retracement structure. It was the original harmonic pattern and is sometimes referred to as the “Gartley 222” pattern. It identifies turning points in the market with an XABCD structure, with specific Fibonacci retracements connecting each point.
###
Bat Pattern
The Bat pattern is a modification of the Gartley pattern, with more precise Fibonacci ratios. The critical aspect of this pattern is the B point, which represents a 38.2% or 50% retracement of the XA leg. The potential reversal zone (PRZ) of the D leg is a crucial indication of the pattern’s completion and is usually at an 88.6% retracement of the XA leg.
###
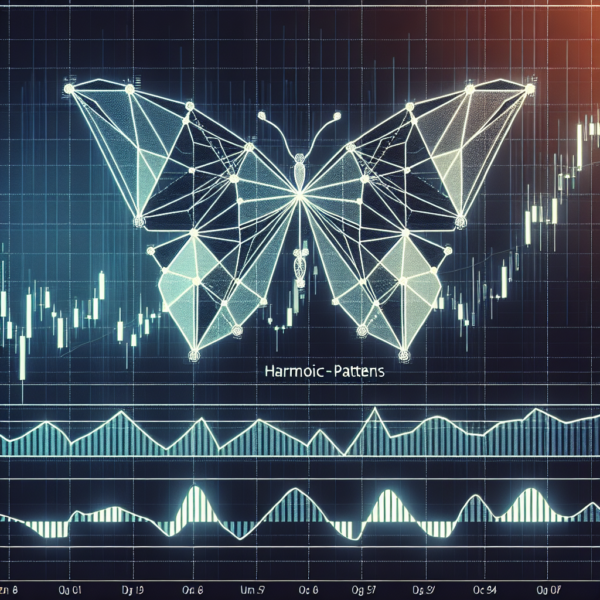
Butterfly Pattern
This pattern is characterized by its distinct wing shape and is ideal for identifying reversals in extreme market conditions. The Butterfly pattern’s D point can extend beyond the initial XA leg, providing a potential reversal signal. Key Fibonacci ratios for this pattern include a 78.6% retracement of the XA leg for point B and a 127% or 161.8% extension of the XA leg for point D.
###
Crab Pattern
The Crab pattern is known for its high accuracy and deep D point, which often hits the 161.8% Fibonacci extension of the XA leg. This pattern emphasizes the extreme potential reversal zone, giving traders a high risk-reward ratio.
##
How to Trade Harmonic Patterns
Trading harmonic patterns requires patience and precision. Here are some steps to consider:
###
Identifying the Pattern
The first step is to identify the potential harmonic pattern as it forms. This can be challenging for beginners, but with practice, recognizing these patterns becomes more manageable.
###
Waiting for Completion
Once a pattern has been identified, it’s essential to wait for it to complete. Entering a trade too early can lead to false signals.
###
Confirming with Other Indicators
Before entering a trade, use other technical indicators for confirmation. This could include oscillators like the Relative Strength Index (RSI) or the Stochastic Oscillator, which can help confirm overbought or oversold conditions.
###
Entering the Trade
After confirmation, the next step is to enter the trade at the completion of the pattern. Setting a stop-loss just outside the potential reversal zone (PRZ) can help limit losses if the market moves in the opposite direction.
###
Setting Profit Targets
Finally, setting realistic profit targets based on previous support and resistance levels, and Fibonacci retracement levels can help lock in gains.
##
Conclusion
Harmonic patterns offer traders a unique way of viewing market movements, providing insights based on the natural order and geometry of the financial markets. While trading these patterns requires a good understanding of Fibonacci ratios and a keen eye for recognizing these patterns as they form, the potential rewards can be significant. With practice and the right approach, harmonic patterns can become a valuable tool in any trader’s arsenal.